
Fig. 3.
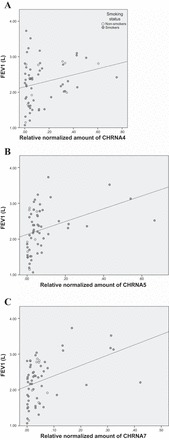
Scatterplots showing significant correlations of forced expiratory volume in 1 s (FEV1) with relative normalized amount of CHRNA4 (A), CHRNA5 (B), and CHRNA7 (C) mRNA expression level.
Official websites use .gov
A
.gov website belongs to an official
government organization in the United States.
Secure .gov websites use HTTPS
A lock (
) or https:// means you've safely
connected to the .gov website. Share sensitive
information only on official, secure websites.
Scatterplots showing significant correlations of forced expiratory volume in 1 s (FEV1) with relative normalized amount of CHRNA4 (A), CHRNA5 (B), and CHRNA7 (C) mRNA expression level.