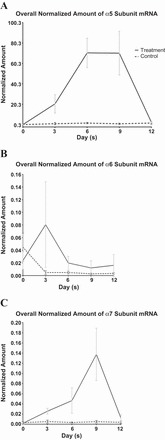
Fig. 4.

Graphic representations of the results of nicotine exposure for 9 days in immortalized bronchial epithelial cells [with the solid lines summarizing mean ± SE of cell lines exposed to nicotine (treatment group) and the dashed lines representing the respective cell lines without exposure to nicotine (control group)] showing sharp rise in nAChR α5 subunit gene expression upon exposure to nicotine (A), with a similar sharp but a slightly delayed rise in nAChR α7 subunit gene expression (C). Both these responses dropped with withdrawal of nicotine on day 9. B: there was also a sharp but not sustained rise in nAChR α6 subunit upon nicotine exposure but it dropped after day 6 before nicotine was removed on day 9.
