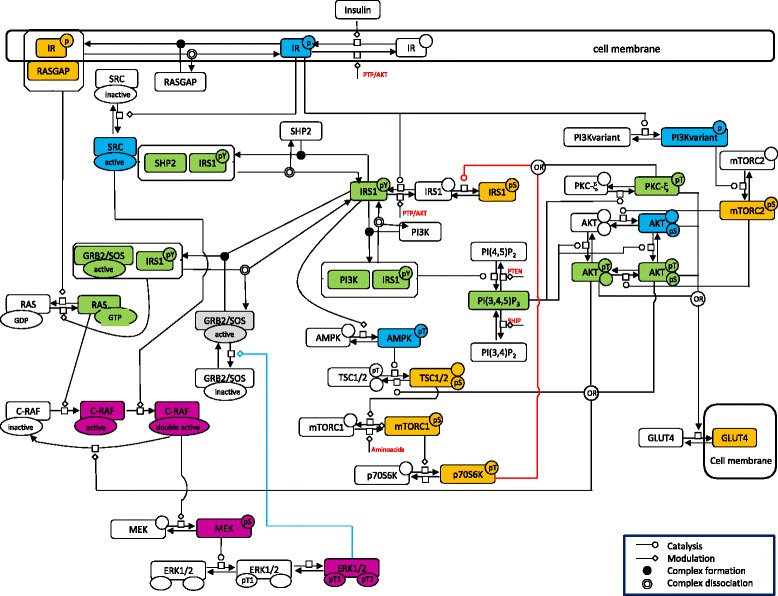
Fig. 1.

The model of insulin signalling pathway. The model of Insulin Signaling Pathway obtained by integrating the PI3K-AKT pathway, the mTOR pathway and the RAS-MAPK pathway, depicted using the Systems Biology Graphical Notation. Coloured nodes resemble the clustering results obtained on simulated profiles (see Fig. 3). Coloured lines represent important feedback mechanisms; namely: the red line represents the P70S6K-IRS1 negative feedback loop, the blue line the ERK1/2-GRB2/SOS negative feedback loop
