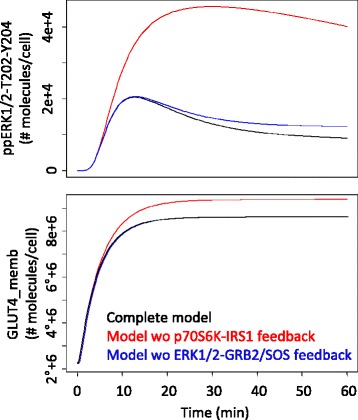
Fig. 4.

Simulated ppERK1/2-T202-Y204 (upper panel) and GLUT4 membrane concentration (lower panel) profiles upon 100 nM insulin stimulation, with the complete model (black), the model without p70S6K-IRS1 feedback (red) and the model without the ERK1/2-GS feedback (blue). This latter does not affect GLUT4 membrane concentration; therefore GLUT4 simulated profiles with and without the ERK1/2-GS feedback are superimposable
