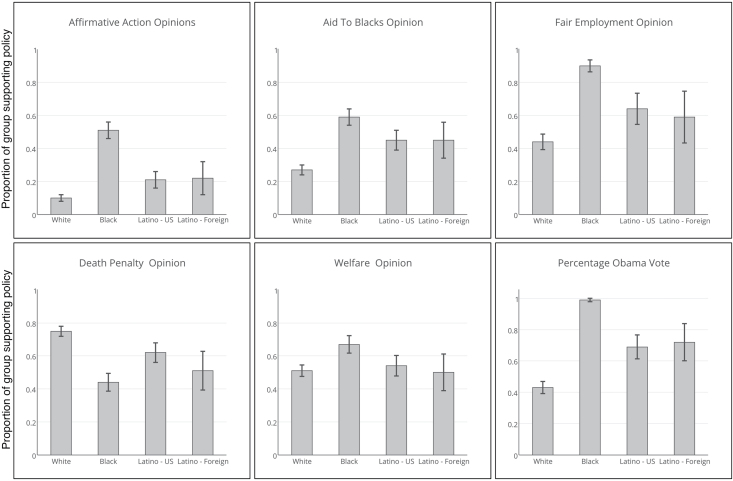
Figure 1.
Public Opinion and Vote Choice in 2008 by Race/Ethnicity. Figure represents the percentage of group supporting policy, data from the 2008 ANES, 95 percent confidence intervals. The fair employment question is branched, and the data in this figure are based on the second of the two branching questions. Incorporating the first part of the branched question yields the following patterns: 22 percent of whites, 60 percent of blacks, 33 percent of US-born Latinos, and 35 percent of foreign-born Latinos support government efforts to end discrimination.

