Fig. 8.

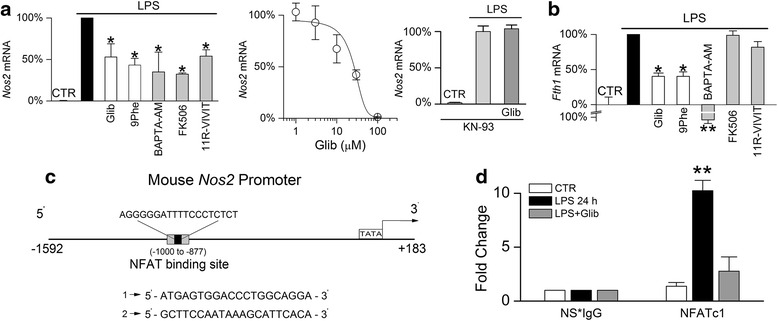
Sur1-Trpm4 regulates the binding of NFATc1 to the Nos2 promoter in murine N9 microglia. a Percent change in mRNA for Nos2 in N9 microglia (left) under control (CTR) conditions, or following 24-h exposure to LPS alone (1 μg/mL), LPS plus glibenclamide (Glib; 30 μM), LPS plus 9-phenanthrol (9Phe; 5 μM), LPS plus BAPTA-AM (10 μM), LPS plus FK506 (1 μM), or LPS plus 11R-VIVIT (10 μM); data normalized to values with LPS alone; five replicates; *p < 0.05; also shown (middle) is the concentration-response relationship for LPS induction of Nos2 mRNA versus glibenclamide concentration; EC50, 26 μM; experiments performed in 5 % fetal bovine serum; three replicates; also shown (right) is the absence of effect of glibenclamide on Nos2 mRNA induction in the presence of the CaMKII inhibitor, KN-93; three replicates. b Percent change in mRNA for Fth1 in N9 microglia under control (CTR) conditions or following 24-h exposure to LPS alone (1 μg/mL), LPS plus glibenclamide (Glib; 30 μM), LPS plus 9-phenanthrol (9Phe; 5 μM), LPS plus BAPTA-AM (10 μM), LPS plus FK506 (1 μM), or LPS plus 11R-VIVIT (10 μM); data normalized to values with LPS alone, which represented a four to fivefold increase; five replicates; *p < 0.05; **p < 0.01. c Schematic of the mouse Nos2 promoter; gray box indicates the region from –1000 to –877 used for PCR, with sequences of primers used to amplify immunoisolated DNA shown below; this region of the promotor contains an NFAT binding site (black box; sequence shown above). d Quantification of immunoisolated DNA following ChIP with an anti-NFATc1 antibody or species-matched non-specific IgG (NS*IgG) from N9 microglia under control (CTR) conditions or following 24-h exposure to LPS alone (1 μg/mL) or LPS plus glibenclamide (Glib; 30 μM); three replicates; **p < 0.01
