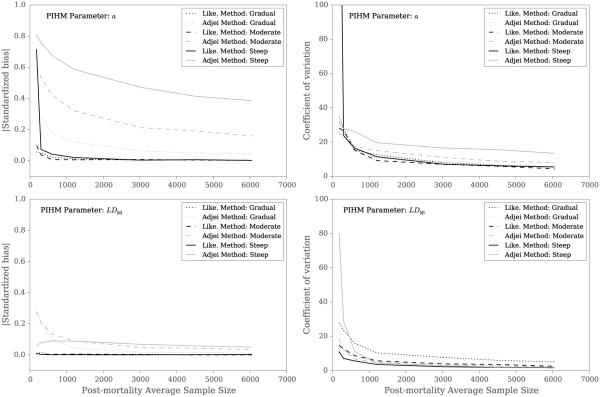
Figure 3.
Bias and precision (coefficient of variation) for the Likelihood Method (Like.) and Adjei Method estimates of the a parameter and the LD50 of the host survival function based on simulated PIHM data over a range of post-mortality sample sizes. As the coefficient of variation increases, precision decreases. The pre-mortality parameters for this simulation were μp = 50 and kp = 0.5. The figure shows the simulations for three different host survival functions (gradual, moderate, and steep), each with the same LD50. Bias and precision results of LD50 and a for all other parameter combinations can be found in SI 3 Fig 4 - 9.

