Fig. 2.

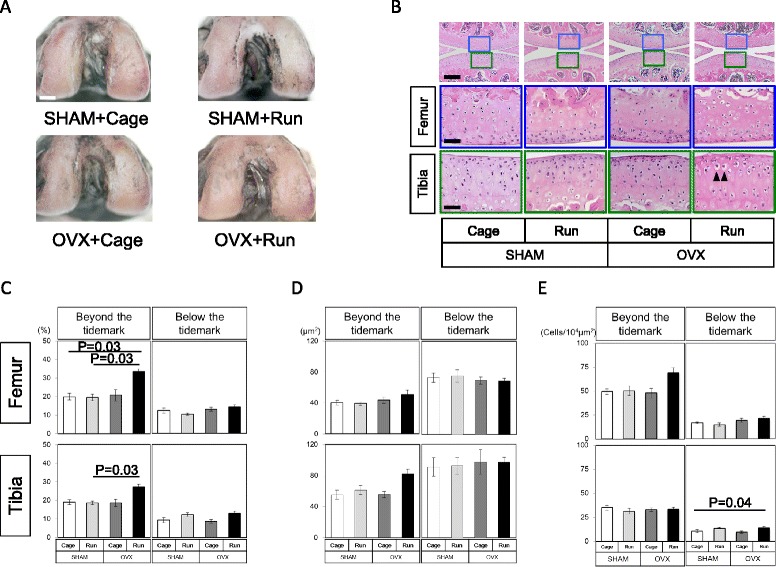
Macroscopic features and morphological analysis of articular cartilage. a Macroscopic observation of femoral articular cartilage stained with India ink. Typical images of the femoral cartilage surface from each of the four experimental groups. In all groups, cartilage surface seemed to remain smooth and similar India ink dyeability was observed macroscopically. Scale bar: 1 mm. Number of mice is 6 in each group. b Histological observation from each group stained with H&E (n = 6 in each group). Boxed areas in the top panels are magnified and presented in the bottom panels. Scale bar: top 100 μm, middle and bottom 25 μm. Arrowheads in OVX + Run group indicate hypertrophic differentiation of articular chondrocytes. c The chondrocyte cellularity of articular cartilage (%), d the size of each chondrocyte lacunae (μm2), and e chondrocyte density (cells/104 μm2) of the femur and the tibia between groups. Values are means with SEM. Differences among each group were assessed using a Kruskal-Wallis one-way analysis of variance by ranks followed by Steel-Dwass’s post-hoc test. An asterisk indicates a statistically significant difference between the groups (n = 6)
