Fig. 8.

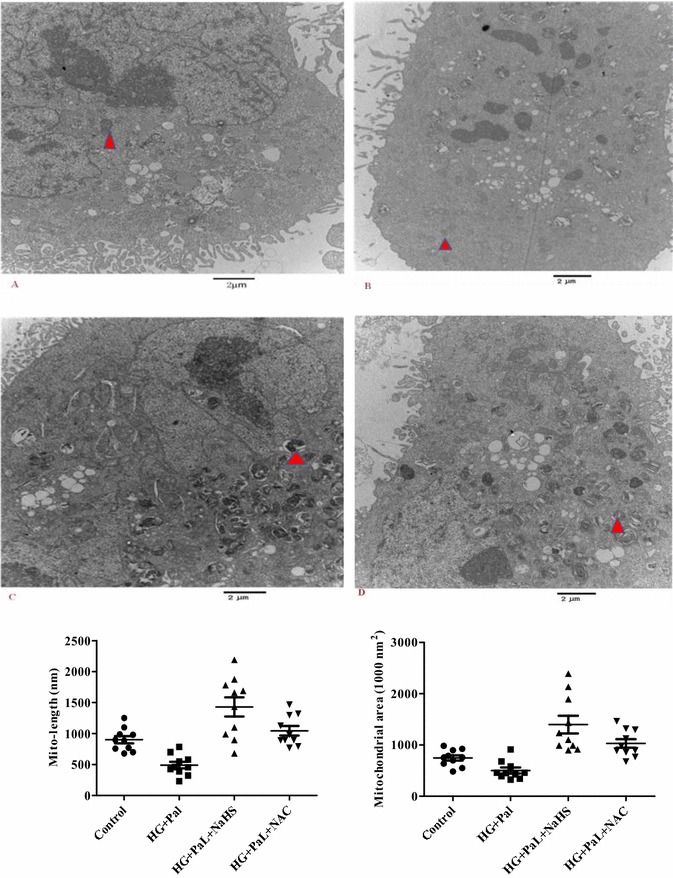
Representative mitochondrial morphology in VSMCs observed using electron microscopy (EM). Scale bar at high magnification = 2 µm. *p < 0.05 vs control, **p < 0.01 vs control, # p < 0.05 vs HG and Pal, and ## p < 0.01 vs HG and Pal

Representative mitochondrial morphology in VSMCs observed using electron microscopy (EM). Scale bar at high magnification = 2 µm. *p < 0.05 vs control, **p < 0.01 vs control, # p < 0.05 vs HG and Pal, and ## p < 0.01 vs HG and Pal