
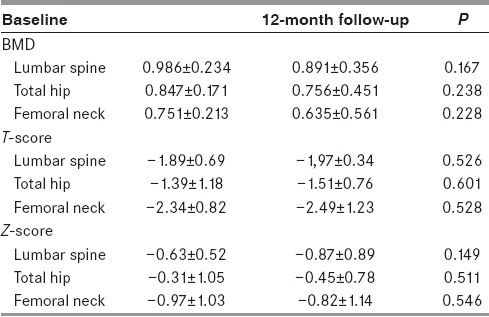
Table 1.
Comparison between BMD, T-score, and Z-score at initial evaluation (baseline) and 12-month follow-up
Official websites use .gov
A
.gov website belongs to an official
government organization in the United States.
Secure .gov websites use HTTPS
A lock (
) or https:// means you've safely
connected to the .gov website. Share sensitive
information only on official, secure websites.
Comparison between BMD, T-score, and Z-score at initial evaluation (baseline) and 12-month follow-up