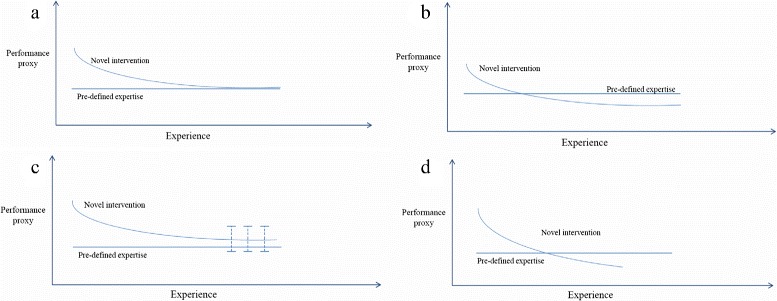
Fig. 1.

Learning curve scenarios for RCT randomisation (low values on the y-axis represent superior performance). Panels a and b depict scenarios where both a pre-defined expertise level and a learning plateau are reached; c depicts a scenario where the pre-defined expertise level is not achieved, and d a scenario where the learning plateau is not reached
