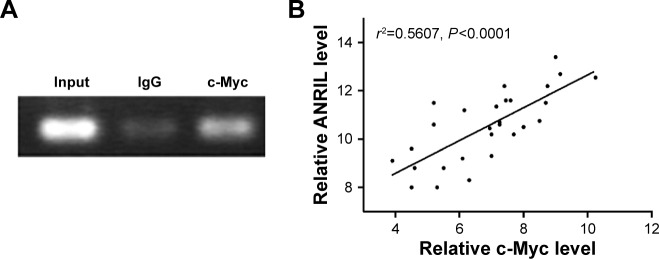
Figure 4.
Identification of the binding activity of c-Myc and the ANRIL promoter and the correlation between ANRIL and c-Myc.
Notes: (A) ChIP was used to confirm the c-Myc-binding activity. The c-Myc antibody effectively enriched the DNA sequence covering the putative binding element. Normal rabbit IgG was used as a negative control and an anti-c-Myc polymerase antibody was used as a positive control. (B) The correlation between ANRIL and c-Myc expression levels in NSCLC tissues (n=28). qRT-PCR was performed in triplicate for each sample and assays were repeated once. The relative levels were normalized to β-actin. Each point in the scatter graph represents an individual sample, in which relative c-Myc levels indicate on x-axis and ANRIL levels on y-axis. The x-axis shows normalized Ct values for c-Myc determined by qRT-PCR. The y-axis shows normalized Ct values for ANRIL determined by qRT-PCR.
Abbreviations: ChIP, chromatin immunoprecipitation; Ct, cycle threshold; IgG, immunoglobulin G; NSCLC, non-small-cell lung cancer; qRT-PCR, quantitative real-time polymerase chain reaction.

