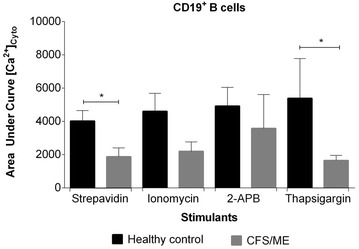
Fig. 3.

Fura-AM cytoplasmic calcium influx in CD19 + B cells. Calcium influx response curve reported as area under the curve was measure during Anti-IgM and anti-CD21 conjugated biotins were cross-linked with streptavidin or in the presence of ionomycin, 2-APB or thapsigargin. Histograms report the means ± SEM. Asterisk denotes statistically significance at P < 0.05
