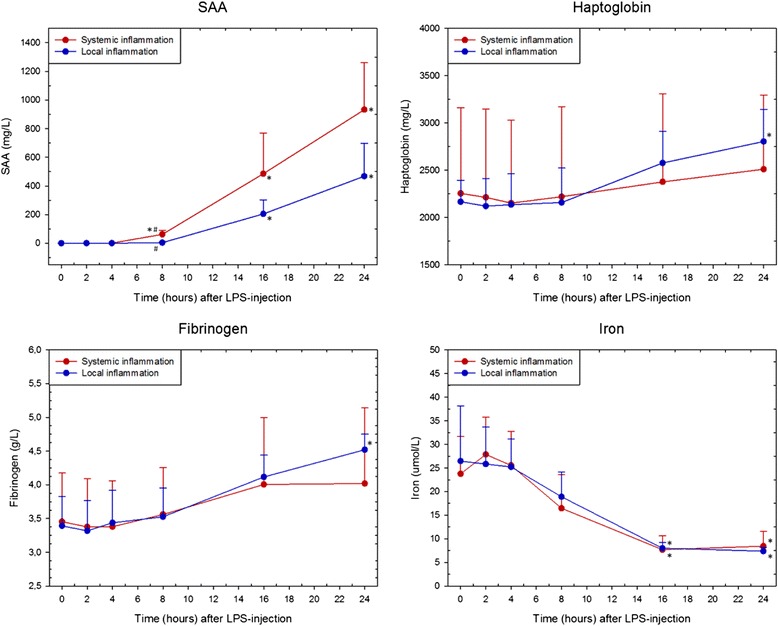
Fig. 2.

Acute phase responses to LPS. Concentration of serum or plasma serum amyloid A (SAA), haptoglobin, fibrinogen, and iron (mean ± SD) in horses with induced systemic (red) and local (blue) inflammation, respectively. Asterisk (*) denotes statistical significant differences compared with baseline levels at PIH 0, while hash tag (#) denotes statistical significant differences between SI and LI horses (P < 0.0063). PIH: post-injection hour
