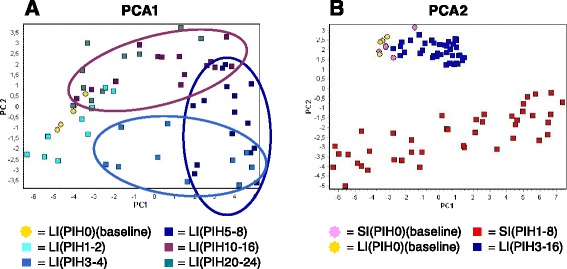
Fig. 3.

Clustering of samples from systemically and locally inflamed horses. Clustering of samples based on the co-expression patterns of 22 innate genes measured in PBLs. Clustering was performed by use of principal component analysis (PCA) in which individual samples were plotted by their two first principal components. a Expression data of all LI samples was divided into the following subgroups: PIH 0 (baselines), PIH 1-2, PIH 3-4, PIH 5-8, PIH 10-16, and PIH 20-24. Ellipses are drawn to highlight the sample subgroups at PIH 3-4, PIH 5-8, and PIH 10-16. b Expression data of SI (PIH 1-8) samples, LI (PIH 3-16) samples, and baseline samples for both study groups. PIH: post-injection hour
