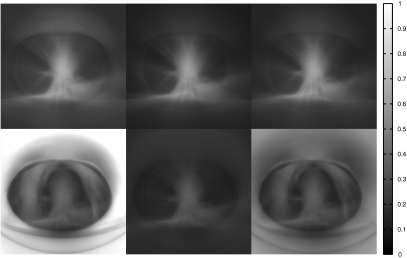
Fig. 4.
Effect of different comparators in the noise of CT images. These are variance maps, with the brightness of pixel proportional to the variance in the reconstruction. The variance maps are for (top row) equivalent monoenergetic images and (bottom row) virtual noncontrast or water material images. The window widths and levels are constant within each row but different from row to row; the equivalent monoenergetic images have had their noise multiplied by 40 to display them on the same scale. The columns correspond to (left) the traditional bank of comparators, (middle) peak-width 2-D binning, and (right) local maxima detection with multicount distinction operating on the comparator signals.

