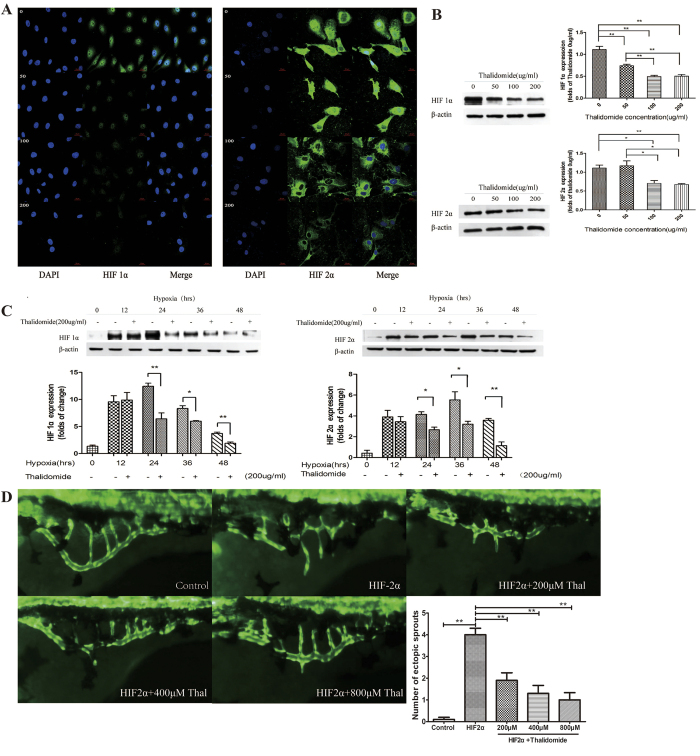
Figure 4. The inhibitory effect of thalidomide.
(A) Immunofluorescence indicated that HIF-1α and HIF-2α expression was down-regulated by thalidomide at different concentrations. (B) Western blots demonstrated that the expression of HIF-1α and HIF-2α decreased with 100 and 200 μg/ml of thalidomide. *P < 0.05, **P < 0.01. (C) Western blots demonstrated that thalidomide at 200 μg/ml inhibited the expression of HIF-1α and HIF-2α in HUVECs after hypoxic treatment for 24, 36, and 48 h. *P < 0.05, **P < 0.01. (D) Fluorescence microscope observations of the effect of thalidomide at different concentrations on vascular development in zebrafish with HIF-2α overexpression. **P < 0.01 vs. HIF-2α.

