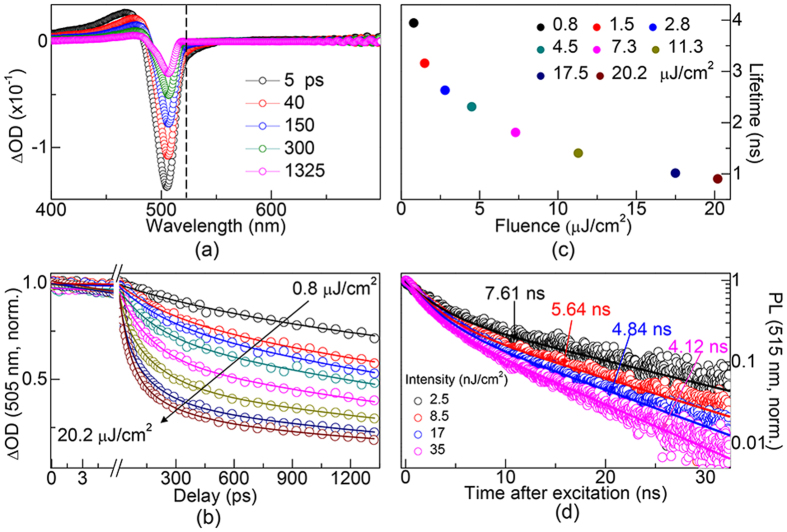
Figure 4. Time-resolved difference absorption spectra of MAPbBr3 QDs which were pumped under 400 nm with intensity at 7.5 μJ cm−2.
The dash line indicates laser induced fluorescence. (b) Fluence-dependent normalized kinetic traces of band-edge (505 nm) transition. The arrows indicate direction of increasing pump intensities ranging from 0.8 to 20.2 μJ cm−2. (c) Lifetimes show decreased trend with elevated pump fluences at decreasing rates. (d) Fluences-dependent time-resolved PL measurements of MAPbBr3 QDs with 405 nm pulses.

