
Figure 4.
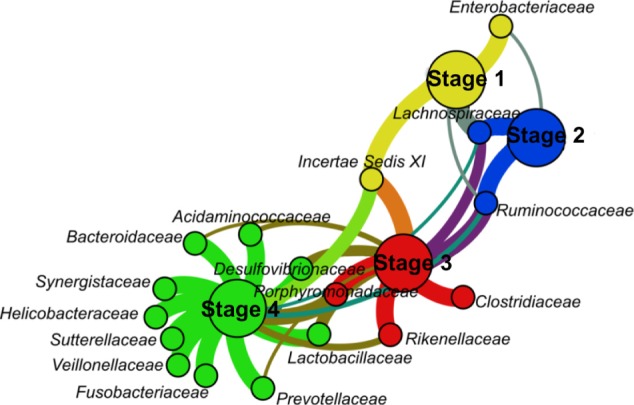
Bipartite graph showing bacterial families exceeding the threshold of 0.5% abundance.
Notes: The color coding is similar to the color coding used in the previous figures. The threshold t = 0.5% was used to omit any vertices as well as edges that do not meet the requirement for sufficient abundance.