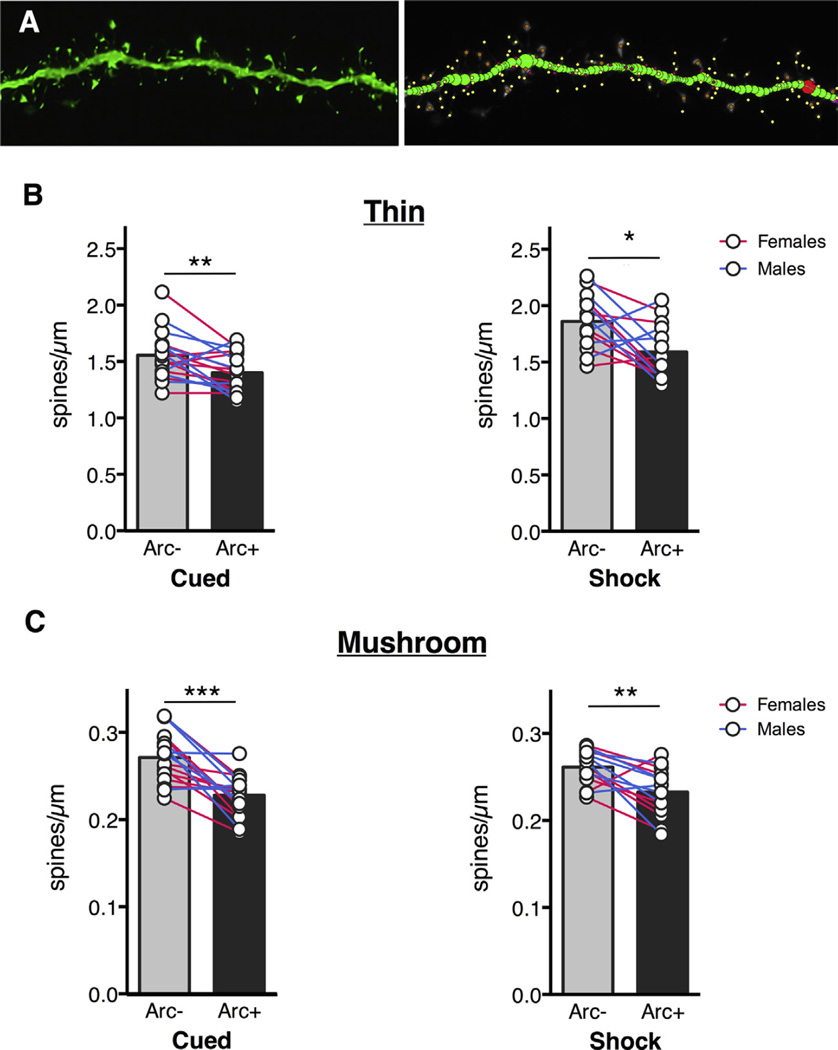
Fig. 3.
BLA Arc+ neurons have fewer spines compared to Arc− neurons after cued or uncued shock presentations. (A) Representative BLA dendritic segment and neuronstudio rendering. Thin spines: yellow, mushroom spines: orange. Thin spine density (B) and mushroom spine density (C) is lower in Arc+ neurons in cued and shock-only conditions. Circles represent averages for individual animals, bars represent group averages. Stars represent significance level of Sidak’s multiple comparison test after ANOVA. *p < 0.05, **p < 0.01, ***p < 0.001. (For interpretation of the references to color in this figure legend, the reader is referred to the web version of this article.)

