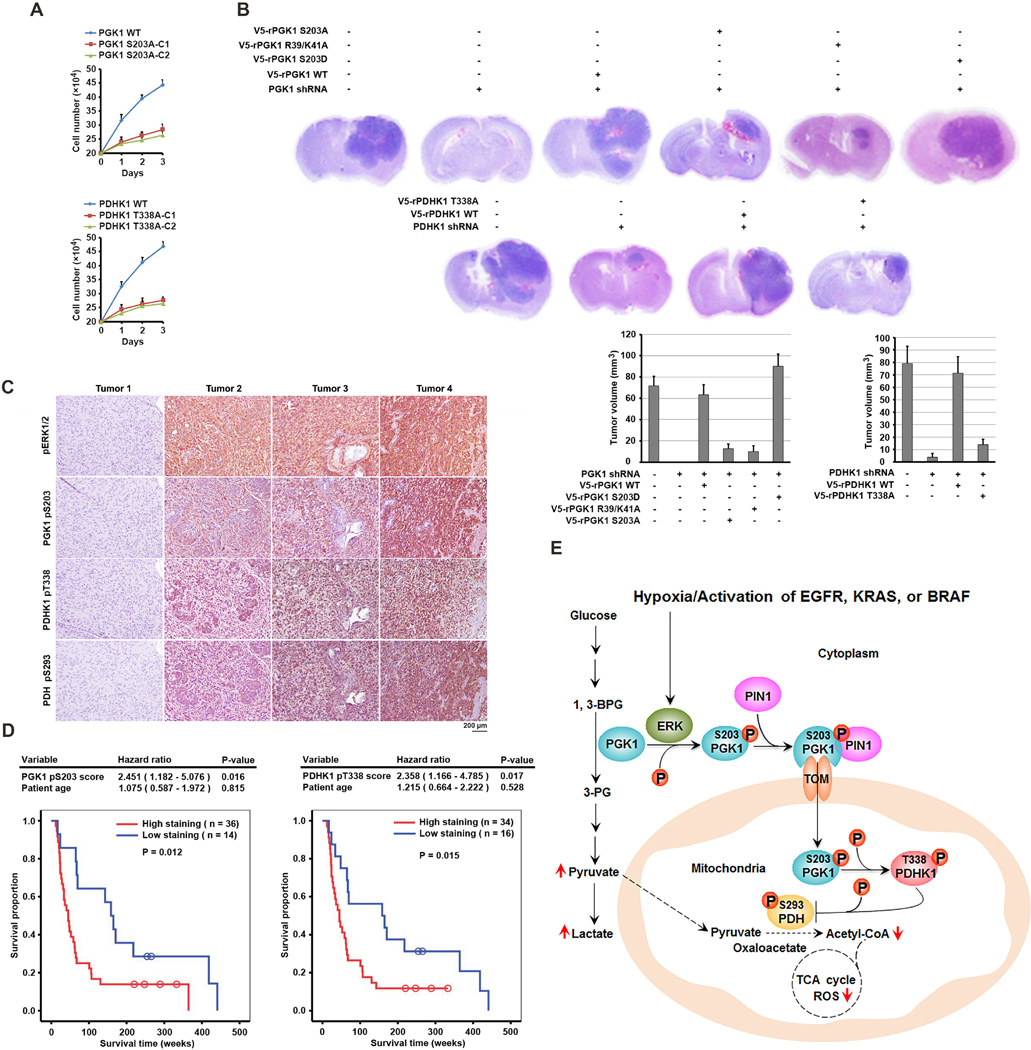
Figure 7. Mitrochondrial PGK1-Dependent PDHK1 Phosphorylation Promotes Cell Proliferation and Brain Tumorigenesis and Indicates a Poor Prognosis in GBM Patients.
(A) Parental U87 cells (2 × 10⁵) and the indicated clones of U87 cells with PGK1 S203A (upper panel) or PDHK1 T338A (lower panel) knock-in were plated for 3 days under hypoxic conditions. The cells were then collected and counted. The data are presented as the means ± SD from three independent experiments.
(B) U87 cells with or without PGK1 shRNA or PDHK1 shRNA expression and with or without reconstituted expression of the indicated proteins were intracranially injected into athymic nude mice. H&E-stained coronal brain sections show representative tumor xenografts. Tumor volume was calculated.
(C) IHC staining with phospho-ERK1/2, PGK1 pS203, PDHK1 pT338, and PDH pS293 antibodies was performed on 50 human primary GBM specimens. Representative photos of four tumors are shown.
(D) The survival time for 50 patients with low (1–4 staining scores, blue curve) versus high (4.1–8 staining scores, red curve) phosphorylation levels of PGK1 S203 (low, 14 patients; high, 36 patients) and PDHK1 T338 (low, 16 patients; high, 34 patients) were compared. The table shows the multivariate analysis results after adjustment for patient age, indicating the significance level of the association of PGK1 S203 (p = 0.016) and PDHK1 T338 (p = 0.017) phosphorylation with patient survival. Empty circles represent censored data from patients alive at last clinical follow-up.
(E) A Mechanism of Mitochondrial PGK1-Coordinated Glycolysis and TCA Cycle in Tumorigenesis. Broken arrows: inhibited directions or reactions.
See also Figures S6, S7.

