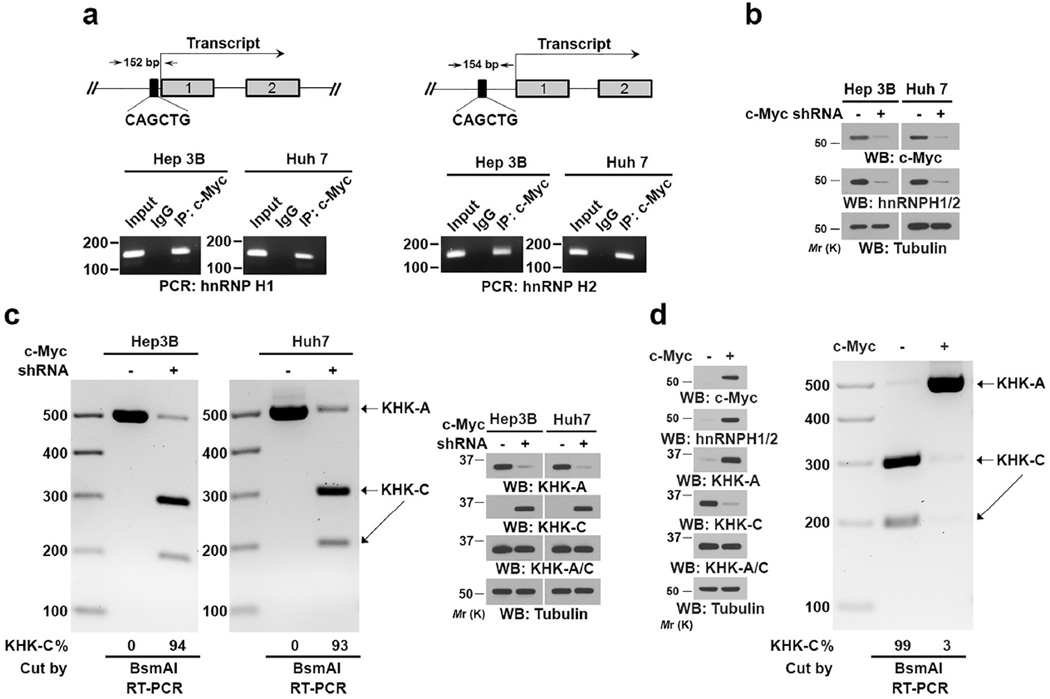
Figure 2. C-Myc–enhanced hnRNPH1/2 expression switches from KHK-C expression to KHK-A expression in HCC cells.
(a) ChIP analyses of the indicated cells were performed with an anti-c-Myc antibody and indicated primers for a promoter region of hnRNPH1 (left panel) or hnRNPH2 (right panel).
(b) The indicated HCC cells with or without c-Myc depletion were analyzed using an immunoblot assay with the indicated antibodies.
(c) The indicated cells did or did not have c-Myc shRNA expression. The RT-PCR products were digested by BsmAI and resolved on an agarose gel (left panel). Immunoblot analysis was performed using the indicated antibodies (right panel). The band intensity was quantified using the Image Lab software program.
(d) Normal hepatocytes were infected with or without lentiviruses expressing c-Myc. Immunoblot assay was performed with the indicated antibodies (left panel). In addition, total RNA was extracted, and the RT-PCR products were digested by BsmAI and resolved on an agarose gel (right panel).
Data represent 1 out of 3 experiments. Unprocessed original scans of blots are shown in Supplementary Fig. 7.

