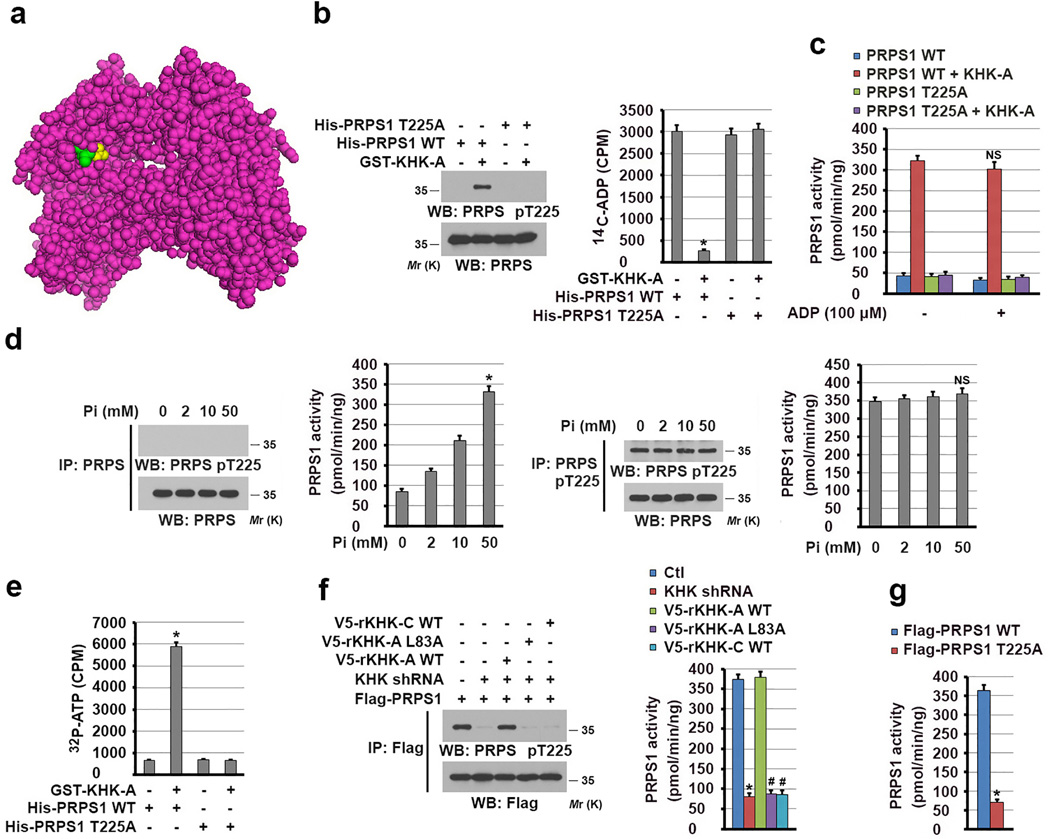
Figure 4. KHK-A-mediated PRPS1 phosphorylation activates PRPS1.
(a) The structure of PRPS1 (PDB code 2HCR), exhibiting binding of sulfate (yellow) to the allosteric site of PRPS1. T225 is shown in green color.
(b) In vitro phosphorylation analysis was performed by mixing bacterially purified GST-KHK-A and the indicated immobilized His-PRPS1 proteins in the presence of ATP. 14C-ADP was then added to the mixture, and His-PRPS1–bound 14C-ADP was measured (right panel). The data represent the mean ± s.d. from n = 3 independent experiments. Immunoblot analysis with the indicated antibodies demonstrated the status of PRPS1 T225 phosphorylation (left panel). A two-tailed Student’s t test was used. * represents P < 0.01 between the phosphorylated and non-phosphorylated PRPS1.
(c) The activity of bacterially purified WT His-PRPS1 or the PRPS1 T225A mutant with or without phosphorylation by GST-KHK-A was measured in the presence or absence of ADP. The data represent the mean ± SD from n = 3 independent experiments. A two-tailed Student’s t test was used. NS represents not significant difference between the indicated sample and the counterpart in the absence of ADP.
(d) The activity of immunoprecipitated PRPS1 from normal hepatocytes (two left-hand panels) and Hep3B cells (two right-hand panels) was measured in the presence of indicated concentrations of phosphate. The data represent the mean ± s.d. from n = 3 independent experiments. A two-tailed Student’s t test was used. * represents P < 0.01; NS represents not significant difference between the indicated sample and the counterpart in the absence of Pi.
(e) [γ32P]-ATP was mixed with WT PRPS1 or the PRPS1 T225A mutant with or without phosphorylation by GST-KHK-A. His-PRPS1–bound [γ32P]-ATP was measured. The data represent the mean ± s.d. from n = 3 independent experiments. A two-tailed Student’s t test was used. * represents P < 0.01 between the phosphorylated and non-phosphorylated PRPS1.
(f) The activity of Flag-PRPS1 immunoprecipitated from Hep3B cells expressing KHK shRNA with or without reconstituted expression of the indicated rKHK proteins was measured (right panel). The data represent the mean ± s.d. from n = 3 independent experiments. Immunoblot analysis with the indicated antibodies demonstrated the status of PRPS1 T225 phosphorylation (left panel). A two-tailed Student’s t test was used. * represents P < 0.01 between the cells with or without KHK depletion. # represents P < 0.01 between the KHK-depleted cells with reconstituted expression of WT rKHK-A and the KHK-depleted cells with reconstituted expression of rKHK-A L83A and WT rKHK-C.
(g) The activity of the indicated Flag-PRPS1 proteins immunoprecipitated from Hep3B cells was measured. The data represent the mean ± s.d. from n = 3 independent experiments. A two-tailed Student’s t test was used. * represents P < 0.01 between the cells expressing WT PRPS1 and PRPS1 T225A.
In b, d, and f, data represent 1 out of 3 experiments. Unprocessed original scans of blots are shown in Supplementary Fig. 7.

