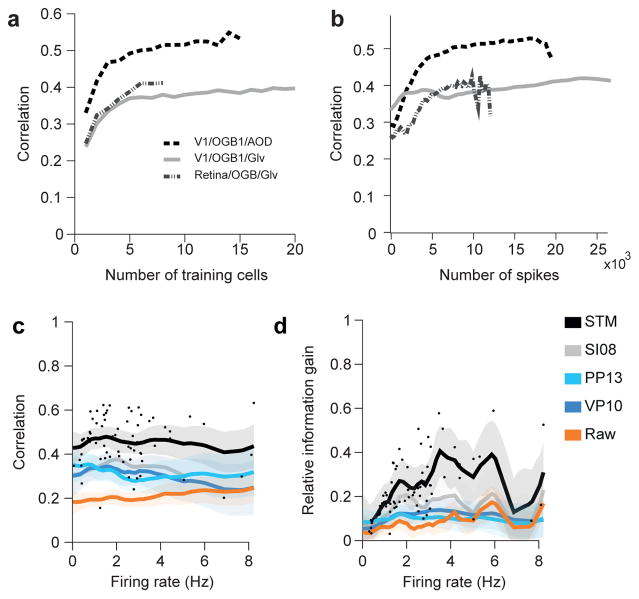
Figure 5. Dependence on training set size and firing rate.
a) Mean correlation for STM model on the four different datasets collected under anesthesia/ex-vivo as a function of the number of neurons/segments in the training set.
b) Mean correlation for STM model as a function of the number of neurons/segments in the training set as a function of the number of spikes in the training set. Large training sets (on the right) lead to less spikes in the test set, making the evaluation noisier.
c) Correlation as a function of average firing rate of a cell. Dots mark correlation of STM model for individual traces. Solid lines indicate mean of a Gaussian process fit to correlation values for each of the indicated algorithms. Shaded areas are 95%-CI.
d) As in c. for relative information gain.

