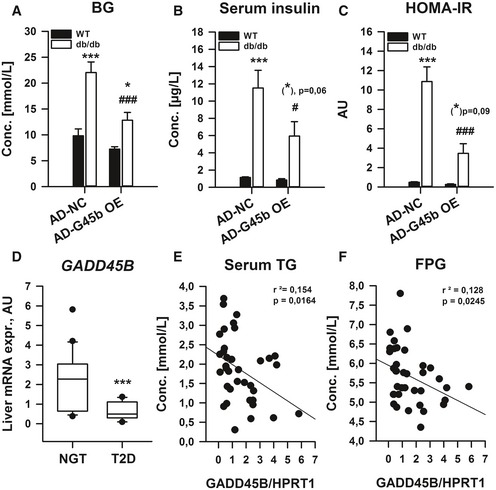
Figure 5. Liver GADD45β expression modulates glucose homoeostatic control in type 2 diabetes.

-
A–CMale 12‐weeks‐old wild‐type (WT; C57Bl/6J) or obese/diabetic (db/db; BKS.Cg‐m+/+ Lepr DB/J) mice with (AD‐G45b OE) or without (AD‐NC) prior liver‐restricted GADD45β over‐expression were fasted, and blood glucose (A) and serum insulin (B) were measured from which HOMA‐IR was calculated (C) (n = 4–6/group). Data are mean ± SEM. Effect of genotype/viral manipulation, *P < 0.05, **P < 0.01, ***P < 0.001. Effect of nutritional state: # P < 0.05, ## P < 0.01, ### P < 0.001.
-
D–FLiver GADD45B mRNA expression from men with (T2D) or without (NGT) type 2 diabetes (n = 14–23/group). ***P < 0.001. Scatter plots fasting plasma triglycerides (E) and glucose (F) in correlation with liver GADD45B mRNA expression (n = 37). Inserts show r 2 values and P‐values from Spearman's correlation test.
