-
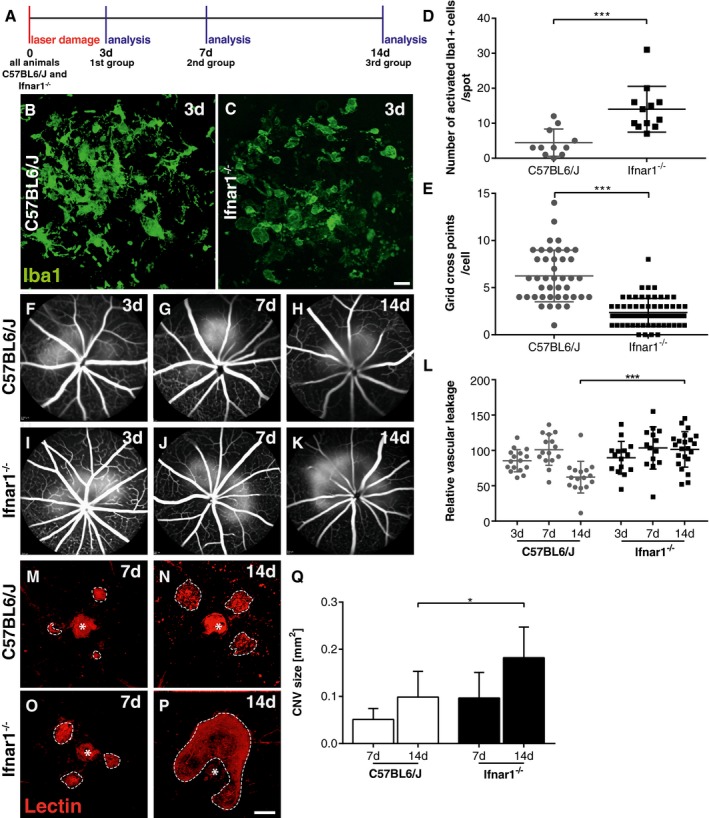
A
Experimental design. Laser coagulation was performed in C57BL6/J control and Ifnar1
−/− mice. Animals were analyzed 3, 7, and 14 days after laser treatment.
-
B, C
Representative Iba1 stainings of retinal flat mounts detecting microglia/macrophages in laser spots 3 days after laser coagulation in C57BL6/J controls (B) and Ifnar1
−/− (C) mice. Scale bar: 20 μm.
-
D
Quantification of amoeboid‐shaped mononuclear phagocytes in laser spots. Values show mean ± SD (n = 11–12 retinas; unpaired Student's t‐test: ***P = 0.0004).
-
E
Quantification of immune cell morphology in laser spots using a grid image analysis system. Values show mean ± SD (n = 42–62 cells; unpaired Student's t‐test: ***P < 0.0001).
-
F–K
Representative fundus fluorescein angiography images of C57BL6/J (F–H) and Ifnar1
−/− (I–K) mice 3, 7, and 14 days after laser‐induced damage.
-
L
Quantification of vascular leakage by analyzing pixel intensities at 3, 7, and 14 days after laser‐induced retinal damage in C57BL6/J controls versus Ifnar1
−/− mice. Values show mean ± SD (n = 14–22 eyes; one‐way ANOVA followed by Tukey's post‐test: ***P < 0.0001).
-
M–P
Representative images of lectin‐stained choroidal flat mounts 7 and 14 days after laser coagulation in C57BL6/J control mice (M, N) and Ifnar1
−/− animals (O, P). Dashed lines indicate CNV areas, and the asterisk marks the central optic nerve head. Scale bar: 200 μm.
-
Q
Quantification of lectin‐stained CNV areas with ImageJ software. Bars show mean ± SD (n = 4–11 RPE/choroidal flat mounts; one‐way ANOVA followed by Tukey's post‐test: *P = 0.0281).

