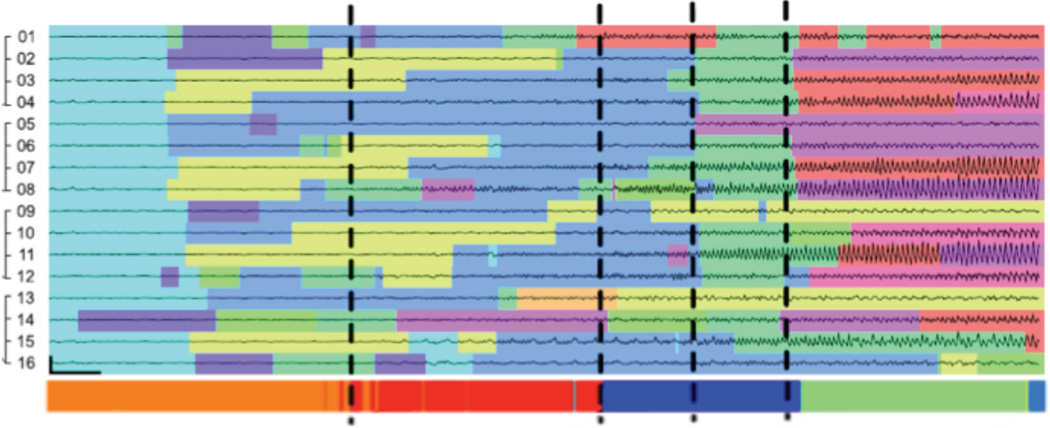
Figure 2.
Data traces from the 16 channel iEEG electrode over 25 seconds of a seizure onset with colors indicating the inferred channel states. Vertical dashed lines indicate the EEG transition times marked independently by an epileptologist. Figure adapted from Wulsin, et al., Modeling the Complex Dynamics and Changing Correlations of Epileptic Events, Artif. Intell. 216, 55–75 (2014).

