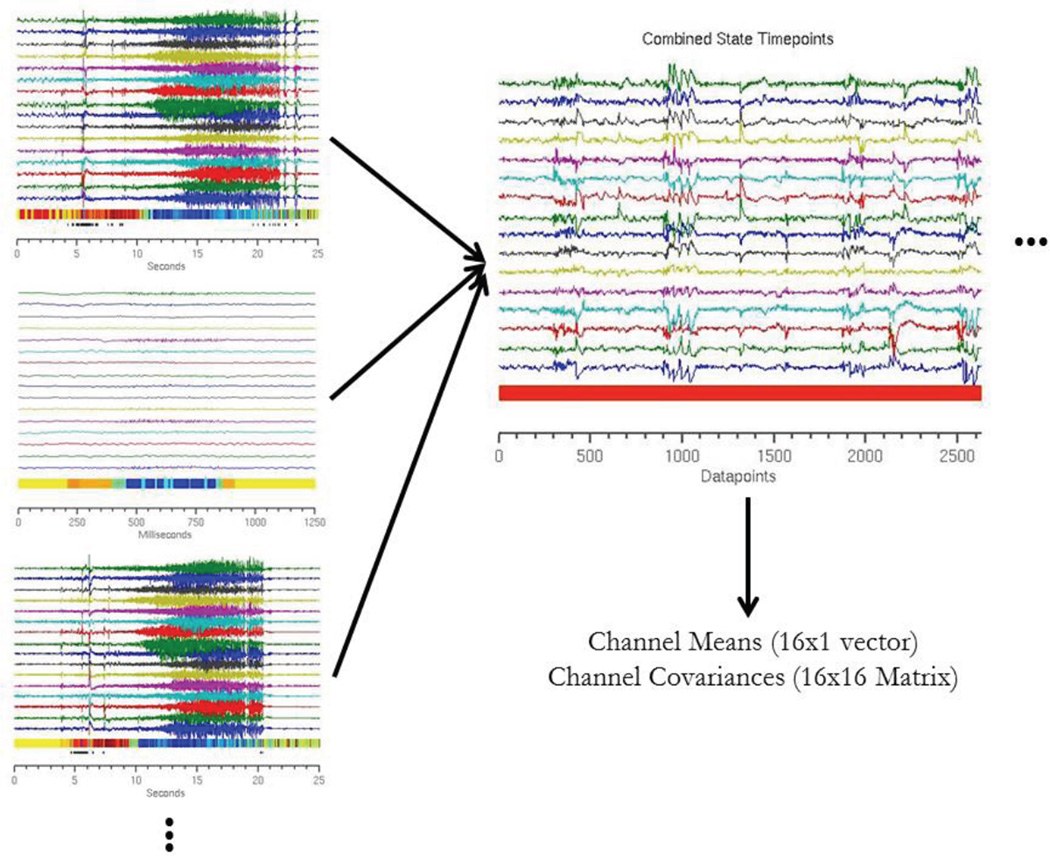
Figure 3.
Schematic of construction of Gaussian distributions. Each time point in the training dataset is assigned an event state based on the AR-HMM. Three sample recording clips are shown, with time points color coded by event state. The time points are then segregated by state to generate a unique dataset for each event state. These datasets are then modeled as a 16-dimensional Gaussian distribution. Figure above illustrates this operation for a single state (color coded as red).

