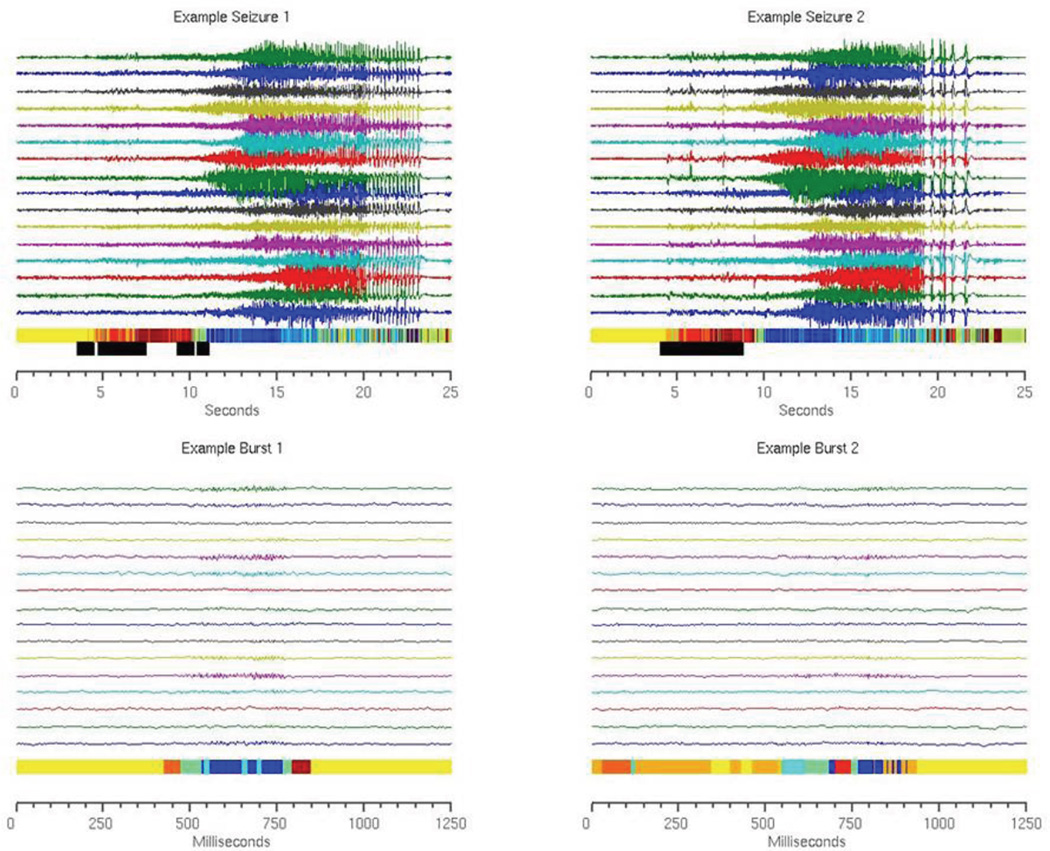
Figure 4.
Sample seizures and bursts from Dog 1. Each time point is color coded by real event state as determined by the AR-HMM. The same seizures and bursts were evaluated using the online Gaussian detection method to determine approximate event states and to identify time points at which the most likely state is an SOI. Time points that fall in sliding windows in which the percentage of predicted SOIs exceeds a set threshold are marked with black bars. These windows are sensitive and specific for seizure onset zones.

