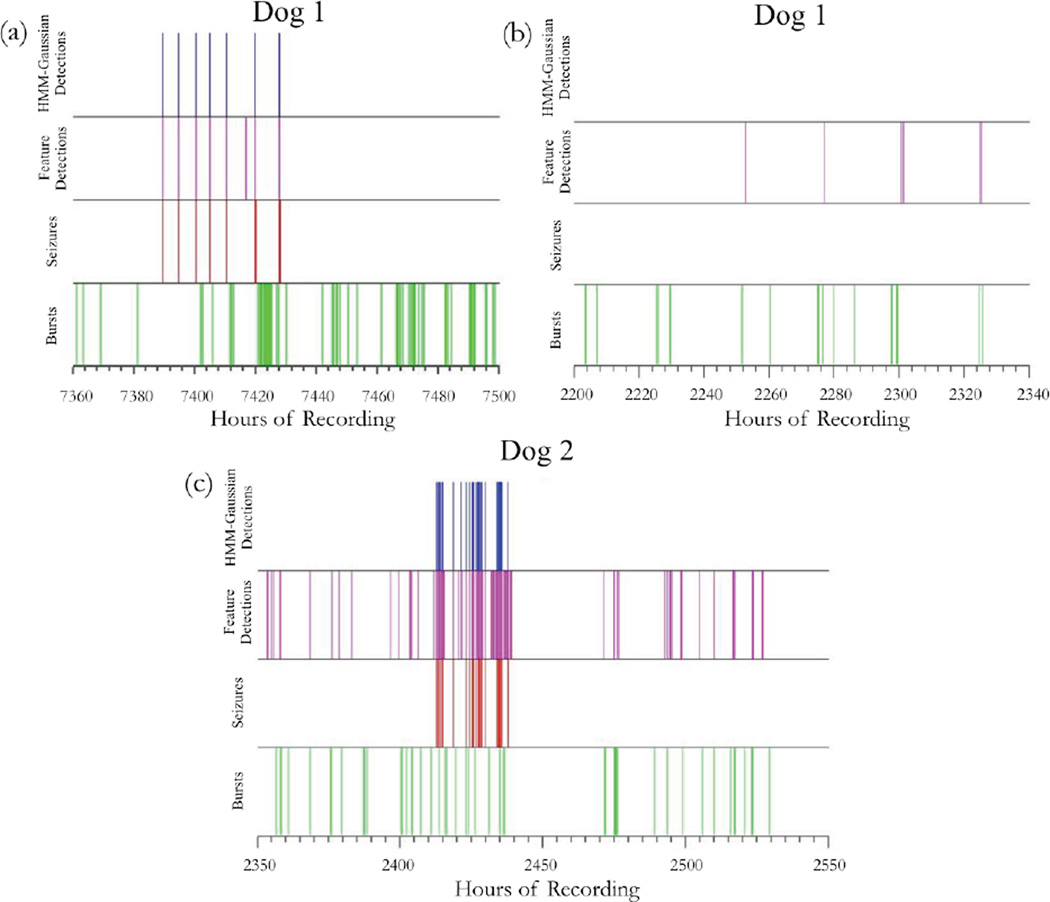
Figure 6.
Representative timeline excerpts from Dog 1 (a and b) and Dog 2 (c). The top row represents detected seizures by the HMM-Gaussian detector, the second row represents detected seizures by the feature-based, NeuroPace-like detector, the third row represents real seizures, and the bottom row represents real bursts. Note that false positives flagged by the NeuroPace-like detector tend to cluster with interictal bursts.

