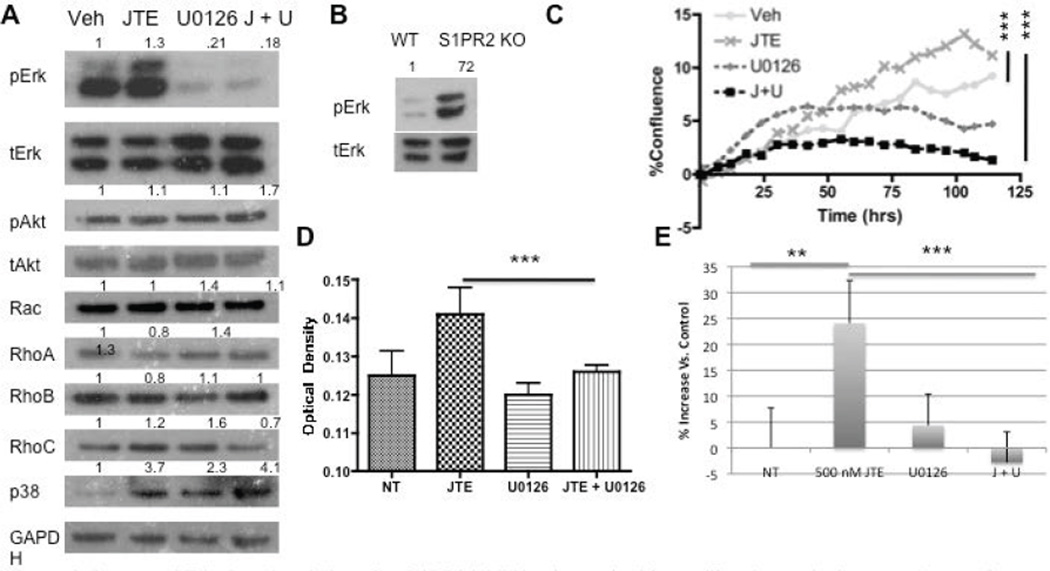
Figure 3.
Increased Erk phosphorylation after S1PR2 inhibition is required for proliferation and migratory changes- A) Western blot analysis of protein activation or expression following 3 µM JTE013 and 1 µM U0126 treatment. A 30-minute U0126 treatment preceded the 30-minute JTE013 treatment. Densitometry reflects expression of the phosphorylated protein relative to total expression for pAkt and pErk or protein expression relative to GAPDH for the remainder; B) Western blot analysis of Erk activation in wild type and S1PR2 KO cells; C) Proliferation of MSCs with the indicated treatments evaluated by Essen biosciences analysis for confluence with p < 0.0001 by one-way ANOVA with bonferonni post test comparisons and similarly by MTS analysis; D) using the same concentrations at 48 hrs following treatment. P < 0.001 by one way ANOVA with bonferroni post test comparison; E) Scratch assay analysis of MSC migration normalized to the vehicle treated control for JTE and U0126 treated MSCs. * indicates p < 0.05, ** indicates p < 0.01, and *** indicates p < 0.001. Statistical evaluation by a Student’s T test unless otherwise indicated. Representative western blots are shown.

