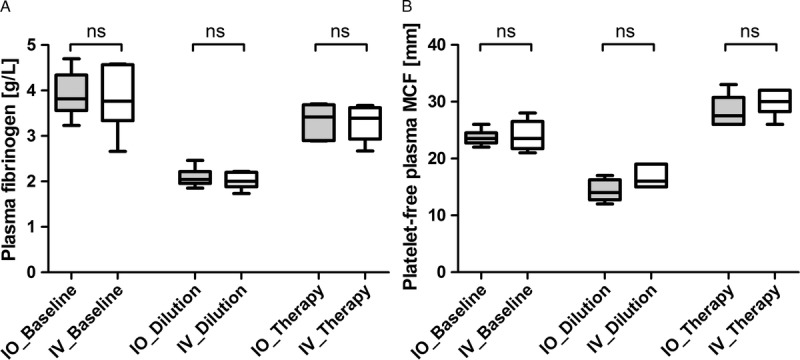
Figure 2.

Effects of intraosseous versus intravenous fibrinogen concentrate on plasma fibrinogen level (A) and thromboelastometric MCF (B) of platelet-free plasma activated with EXTEM. Data presented are median, interquartile range, and range. Shaded boxes represent the IO group; white boxes represent the IV group. ns, not significant.
