
Figure 3.
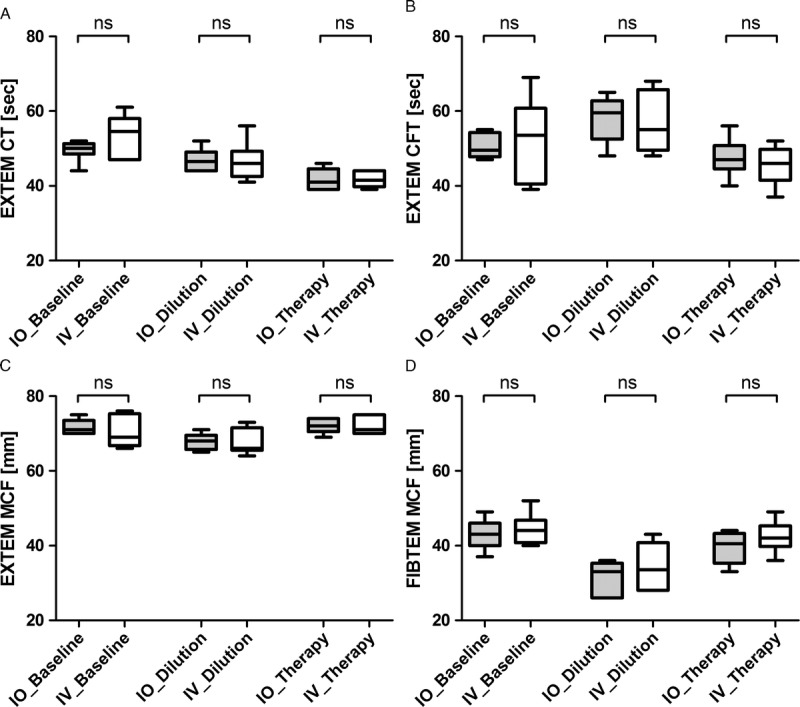
Effects of intraosseous versus intravenous fibrinogen concentrate on thromboelastometric measurement of whole blood, using EXTEM CT (A), CFT (B), and MCF (C) as well as FIBTEM MCF (D). Data presented are median, interquartile range, and range. Shaded boxes represent the IO group; white boxes represent the IV group. ns, not significant.