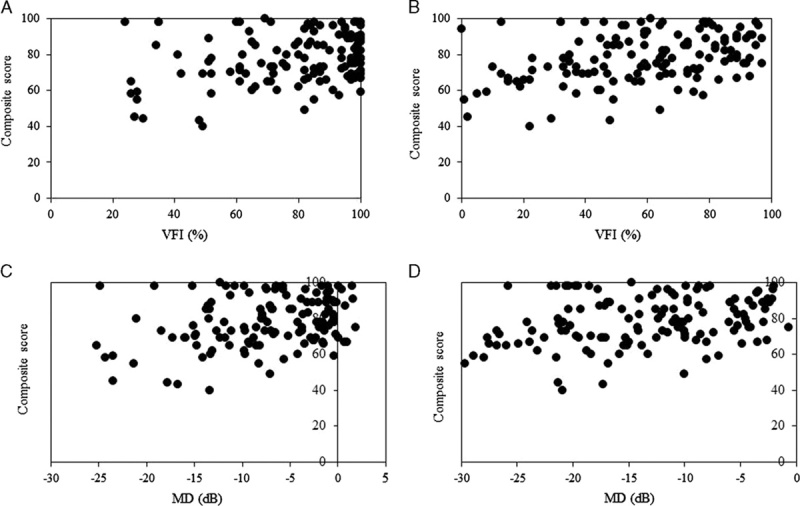
FIGURE 1.

Scatter plot showing the relationship between composite scores on the short-form 11-item Japanese version of the Visual Function Questionnaire and the worse eye with visual field index (VFI) scores (A), the better eye with VFI scores (B), the better eye with MD (C) and the worse eye with MD (D) obtained using program 30-2 of the Humphrey Field Analyzer.
