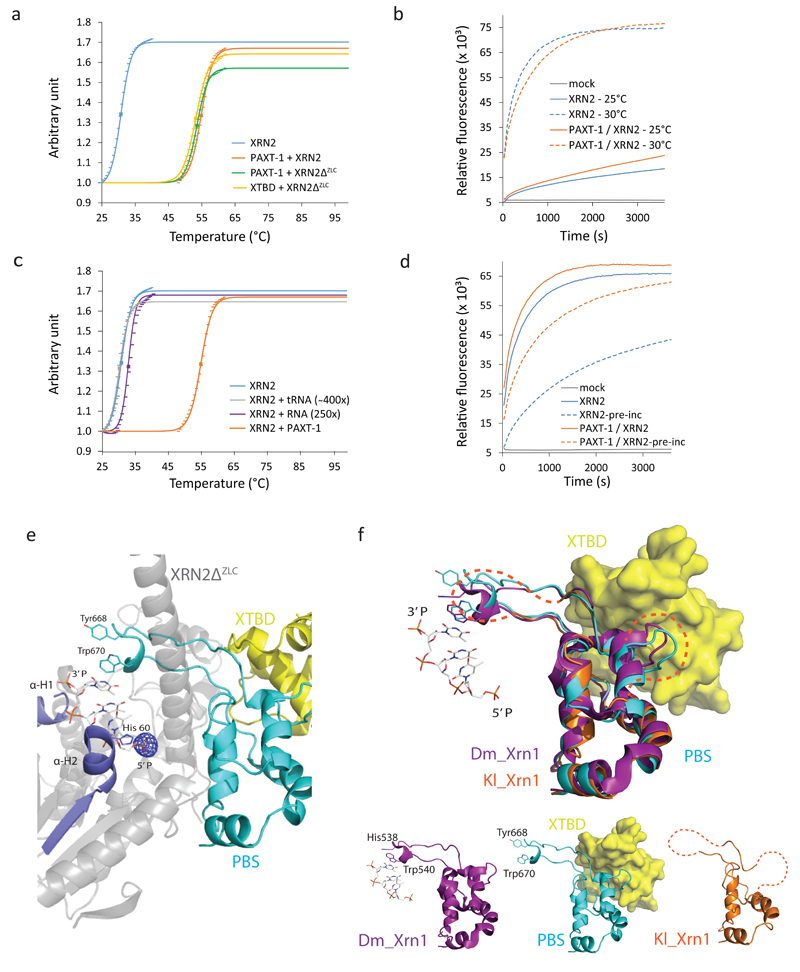
Figure 4.
XTBD or RNA substrate, respectively, stabilize XRN2 by promoting PBS folding. (a), (c) Graphs showing unfolding of (a) XRN2 alone and its indicated complexes, and (c) XRN2 in the presence of an RNA substrate or tRNA, respectively. Results for XRN2 alone and XRN2 – PAXT-1 from (a) are included for comparison. (a), (c) Data points of the sigmoidal part of each melt curve and their fits to the Boltzman equation, normalized to 1 and scaled, are indicated. Squares represent melting points (Tm). (b) Plot of activity over time of XRN2 and its complex, respectively, at 25°C and 30°C, respectively. ‘Mock’ is the negative control (no enzyme) at 30°C. (d) Plot of activity of XRN2 alone and its complex with or without preincubation at 30°C. (e) Representation of XRN2 substrate binding, inferred by superposition of XRN2ΔZLC (gray/red/cyan) in complex with XTBD (yellow) on D. melanogaster XRN1 in complex with substrate (PDB 2Y35 20). For the latter, only substrate is shown, in stick model. An mFo-DFc map of the XTBD–XRN2ΔZLC complex (calculated in absence of SO42-) is overlaid and displayed at the SO42- position only (5.5 σ). (f) Comparison of the PBSs of C. elegans XRN2 (cyan) in complex with XTBD (yellow, surface representation), D. melanogaster XRN1 (purple; PDB 2Y35 20) in complex with a tri-nucleotide substrate (stick-model), and K. lactis XRN1 (orange; PDB 3PIF 29) by superposition (top) or individual representation (bottom). Disordered regions within the K. lactis PBS are marked in orange dashed lines.

