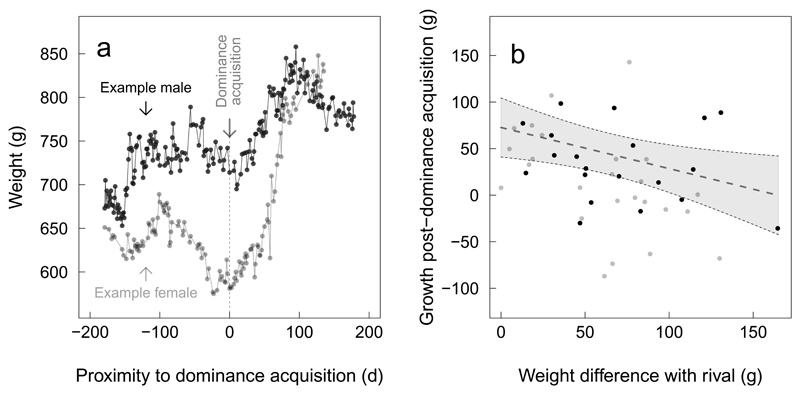
Figure 2. Competitive growth in dominants.
Panel a: example growth trajectories of a male and female during their transition to dominance. Panel b: adjustment of growth following dominance acquisition in response to social competition in 20 males and 25 females. Dots show the raw values (grey for females, black for males) of dominant weight gain within the 150 days following dominance acquisition as a function of weight difference to the heaviest same-sex subordinate (measured at dominance acquisition). The dotted line shows the predicted values of the linear model (results presented in Extended Table 3) and standard deviations of the predicted values are delineated by shaded areas.

