
Fig. 3.
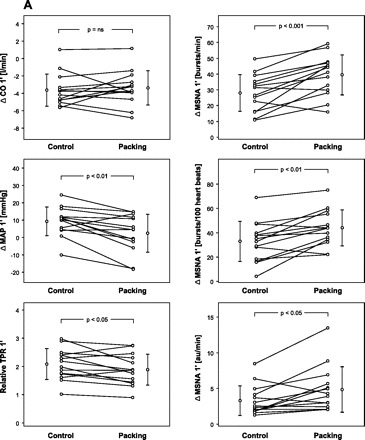
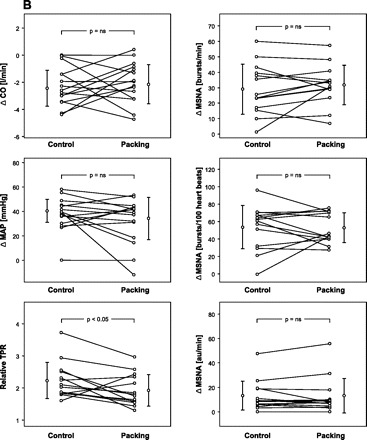
Comparison of changes (Δ) in hemodynamics and sympathetic vasoconstrictor activity at the early (A) and late stage of apnea (B). CO, cardiac output; MAP, mean arterial pressure; TPR, total peripheral resistance.
Official websites use .gov
A
.gov website belongs to an official
government organization in the United States.
Secure .gov websites use HTTPS
A lock (
) or https:// means you've safely
connected to the .gov website. Share sensitive
information only on official, secure websites.
Comparison of changes (Δ) in hemodynamics and sympathetic vasoconstrictor activity at the early (A) and late stage of apnea (B). CO, cardiac output; MAP, mean arterial pressure; TPR, total peripheral resistance.