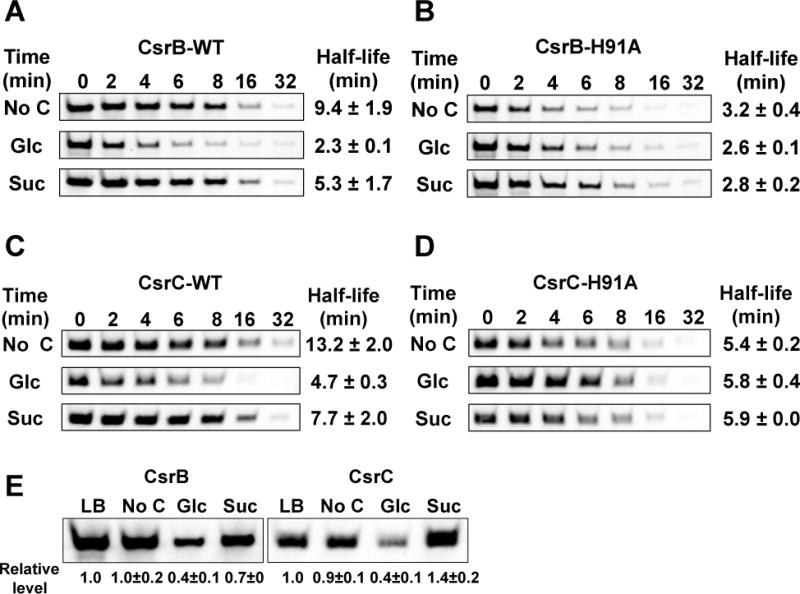
Figure 8.

CsrB/C decay rates and levels after shift from LB to minimal media.
A, B, C and D. Decay rates of CsrB (A and B) and CsrC (C and D) determined by Northern blotting of RNA from E. coli MG1655 (WT) and mutant strain H91A (unphosphorylatable EIIAGlc). Strains were grown in LB broth to exponential phase, washed and reinoculated into M9 minimal medium without carbon or with 0.2% glucose or succinate. Rifampicin was added 10 min after inoculation into minimal media and RNA half-lives determined as in Figure 1.
E. CsrB/C steady state levels determined by Northern blotting of RNA from E. coli MG1655 (WT) in LB broth at exponential growth phase and 10 min after inoculation into minimal media.
