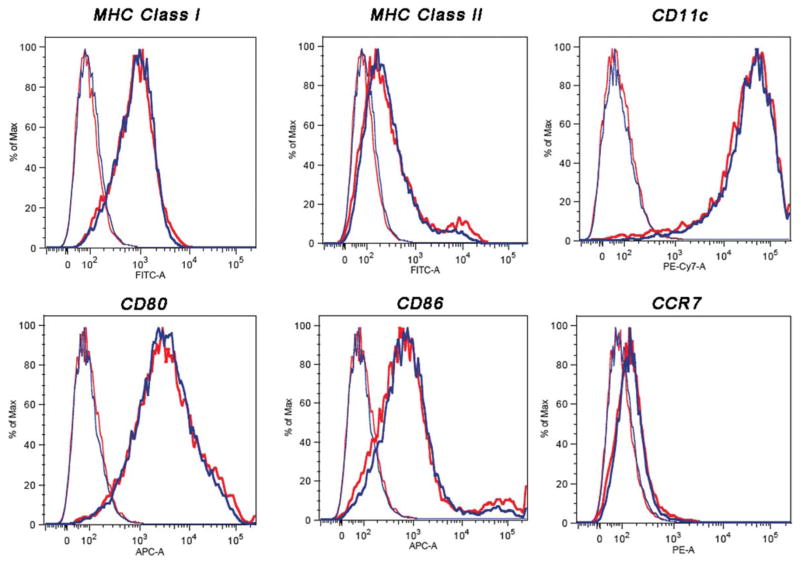
FIG. 3.
Cell surface phenotype as determined by flow cytometry of unlabeled (blue) and SPIO-labeled (red) murine-derived DCs. After 1 h of incubation with SPIO in the presence of PL, cells were stained with phycoerythrin-conjugated monoclonal antibodies for CD11c, presentation receptors MHC-I and MHC-II, costimulatory receptors CD80 and CD86, and chemokine receptors CCR7. The left histograms represent unstained labeled and unlabeled cells as controls. The shifted histograms represent stained labeled and unlabeled DCs. The y-axis of each histogram shows the relative cell number; the x-axis shows the log fluorescence intensity.

