Fig. 3.

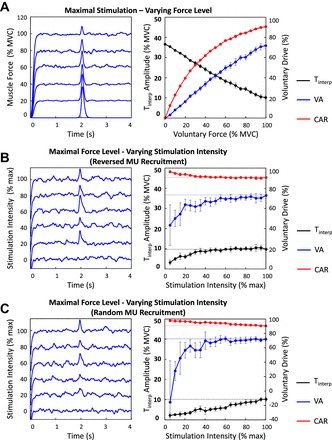
Amplitude of the interpolated twitch and voluntary drive as a function of voluntary force and stimulation intensity. Left: A: voluntary muscle force simulated at force levels increasing from 0% to 100% maximal voluntary contraction (MVC) with superimposed single maximal stimulus. B and C: voluntary muscle force simulated at 100% MVC with superimposed single stimulus elicited at stimulation intensities increasing from 0% to maximal. Electrical stimulation was modeled to activate motor units in order of inverse physiological recruitment (B) and in random order (C). Right: amplitude of Tinterp, VA, and CAR as a function of increasing voluntary force (A) and stimulation intensity (B and C). Values are displayed as averages ± SD of the estimates from 10 repetitions of the simulated protocol.
