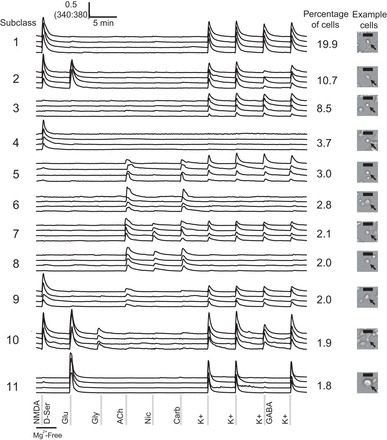
Fig. 1.

Cellular subclasses of the cerebellum classified by receptor-agonist and membrane-potential challenges. The 11 most frequently observed subclasses are shown. Four traces, each from an individual cell, are depicted as representative members of each subclass. The percentages of cerebellar cells clustered into each subclass are provided, and an example of cell morphology and size of cells in each subclass is provided on the right. Black scale bars represent 20 μm. Cells that responded to potassium depolarization are neurons, and those that did not respond to depolarization are presumed to be glia. Ligand concentrations of the pharmacological agents are the following: NMDA/d-serine, 200 μM N-methyl-d-aspartate (NMDA) with 20 μM d-serine in magnesium-free (Mg2+-Free) buffer; Glu, 300 μM glutamate; Gly, 200 μM glycine; ACh, 1 mM acetylcholine; Nic, 200 μM nicotine; Carb, 1 mM carbamylcholine; K+, 30 mM potassium; and K+/GABA, 30 mM potassium with 1 mM GABA. Data were generated from 4 mice, 7 experimental wells, and 5,825 cells.
