
Figure 4. Glucocorticoid responsiveness of PTPN11 is higher in rheumatoid arthritis fibroblast-like synoviocytes versus osteoarthritis fibroblast-like synoviocytes and depends on the differentially methylated CpG sites in the PTPN11 enhancer.
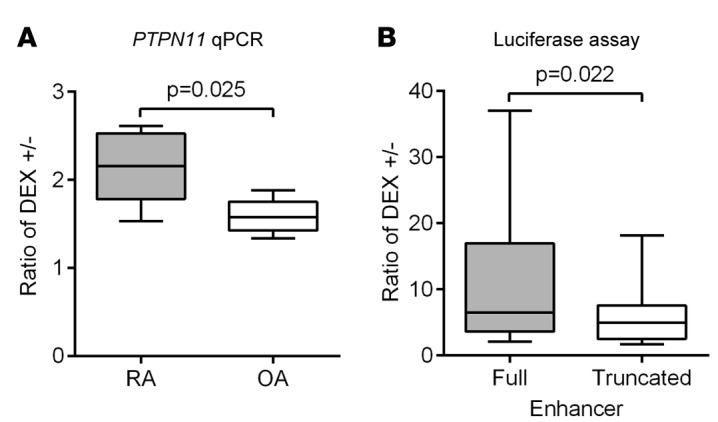
(A) After serum starvation for 24 hours, rheumatoid arthritis (RA) or osteoarthritis (OA) fibroblast-like synoviocytes (FLS) were treated with 100 nM dexamethasone (DEX) for 24 hours. PTPN11 mRNA expression was analyzed by qPCR and normalized to GAPDH expression. Box-and-whisker plots depict median (line within box), 25th percentile and 75th percentile (bottom and top borders), and range of minimum to maximum values (whiskers) of the ratio of relative PTPN11 expression in DEX-treated versus untreated cells from 5 independent experiments with different RA or OA FLS lines. Data were analyzed using the 2-tailed unpaired t test. (B) Truncated PTPN11 enhancer luciferase reporter vector was made by deleting the 81-bp region between the 2 hypermethylated CpG sites (CpGs #6 and #7; shown in Figure 1C) from the PTPN11 enhancer luciferase reporter vector. The full or truncated PTPN11 enhancer luciferase reporter vector was cotransfected into RA FLS with renilla plasmid. After serum starvation for 24 hours, RA FLS were treated with medium or 100 nM DEX for 24 hours, and firefly luciferase activity was measured and normalized to renilla luciferase activity. Box-and-whisker plots depict the ratio of relative luciferase activity in DEX-treated cells versus untreated cells of independent experiments with 12 different RA FLS lines. Data were analyzed using the 2-tailed paired t test.