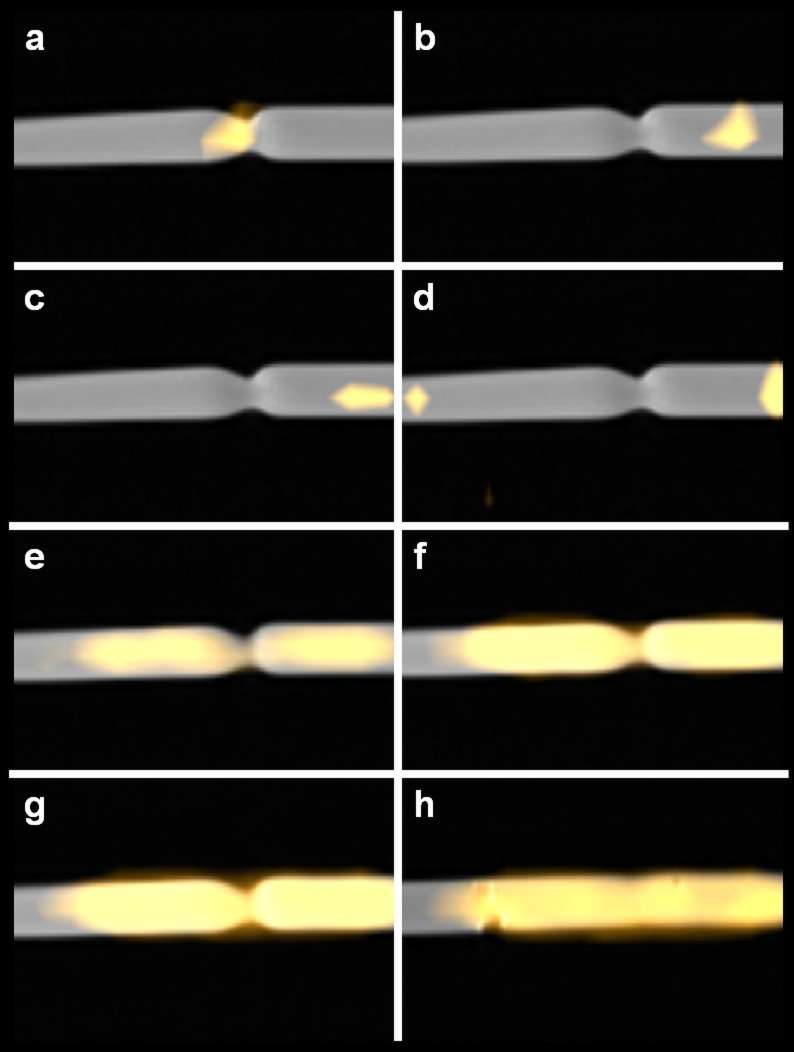
Fig 7. MPI/MRI road mapping of balloon angioplasty.
MPI/MRI fused images in sagittal orientation (PD-weighted MRI and MPI-Signal) displayed in a timeline during the simulated angioplasty procedure. (a) The labeled guidewire was placed (from left to right) in the center and (b, c) beyond the stenosis. (d) The balloon catheter was placed over the wire passing the stenosis with two signals from the lacquer marks—compare Fig 3—barely fit within the FoV of the MPI. (e) The balloon catheter is slightly inflated to 4.5 bar adapting to the contour of the stenosis and thereby making it visible. (f) Then the balloon pressure is gradually increased and the balloon consecutively increases in diameter until (g) the ligature/string ruptures at a pressure of 20 bar simulating the removal of the vessel phantom stenosis. (h) Fused MPI-MRI image of the fully inflated balloon after successful in-vitro angioplasty, a minimal remaining stenosis is visible.

