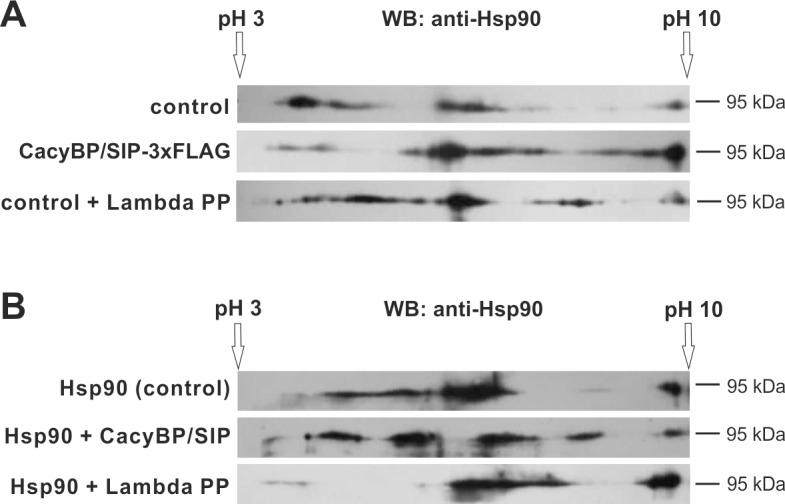
Fig 9. Pattern of spots representing Hsp90 forms with different pI values.

(A) Pattern of Hsp90 spots in HEp-2 cell lysate. Upper panel: HEp-2 cells co-transfected with plasmids encoding Hsp90β-3xFLAG and 3xFLAG (control). Middle panel: HEp-2 cells co-transfected with plasmids encoding Hsp90β-3xFLAG and CacyBP/SIP-3xFLAG. Bottom panel: HEp-2 cells co-transfected with plasmids encoding Hsp90β-3xFLAG and 3xFLAG (control) but lysate was incubated with Lambda Protein Phosphatase (Lambda PP). (B) Pattern of spots corresponding to purified Hsp90. Upper panel: Hsp90 (control). Middle panel: Hsp90 incubated with recombinant CacyBP/SIP. Bottom panel: Hsp90 incubated with Lambda Protein Phosphatase (Lambda PP). A representative Western blot, out of 3 performed after two dimensional (2D) electrophoresis, is shown.
