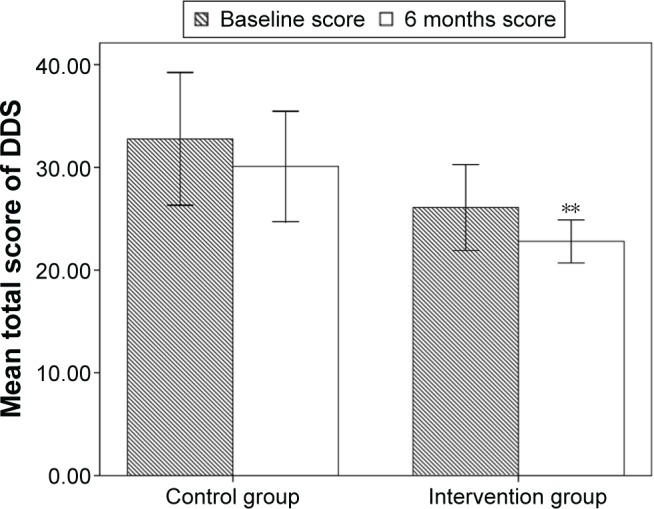
Figure 3.

Mean total score of diabetes distress scale (DDS) of patients with type 2 diabetes in the intervention group and control group before and 6 months after the learning period.
Notes: **P<0.01 between the scores within one group. Error bars represent the standard deviation of total scores.
