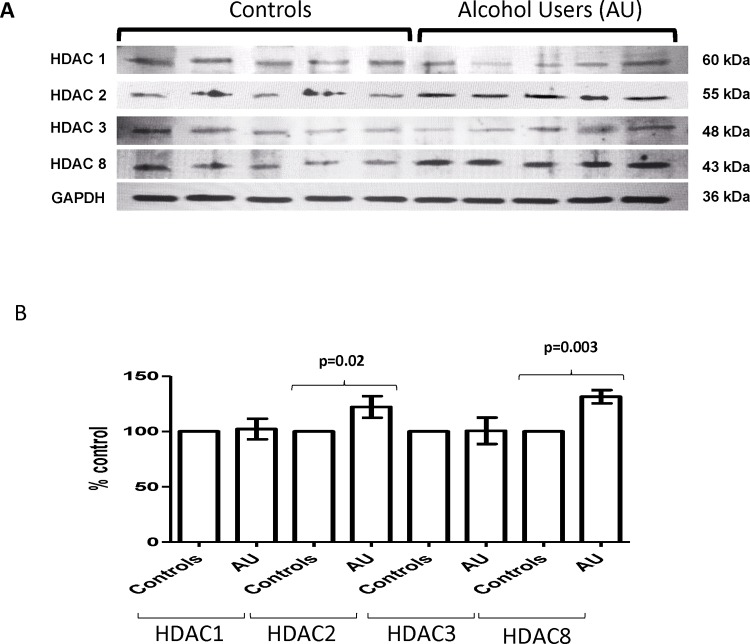
Fig 3. Alcohol Induces Protein Levels of HDACs ex vivo in MDDCs from Alcohol Users.
A) Representative blot is shown for MDDC from alcohol users and non-users. Whole cell lysates (20 μg) were used for western blot analysis. B) Optical densities (OD) were analyzed using Image J software. Protein quantification is expressed as percentage of control ± SEM of ten OD readings per HDAC. p≤0.05 is considered significant.

