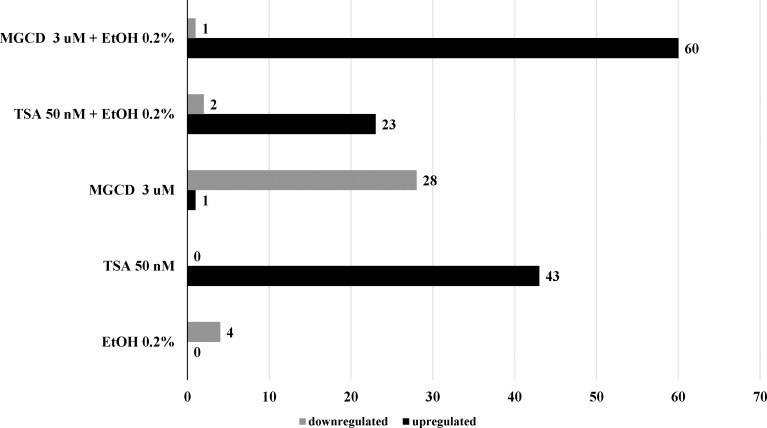
Fig 6. Distribution of Upregulated and Downregulated Genes among Treatment Groups.
Out of 84 genes analyzed, only genes (± 5 fold) dysregulated were shown in this graph. Genes were grouped based on their fold upregulation or downregulation after treatment with alcohol (EtOH 0.2%) alone and/ or HDACi, TSA and MGCD0103.

