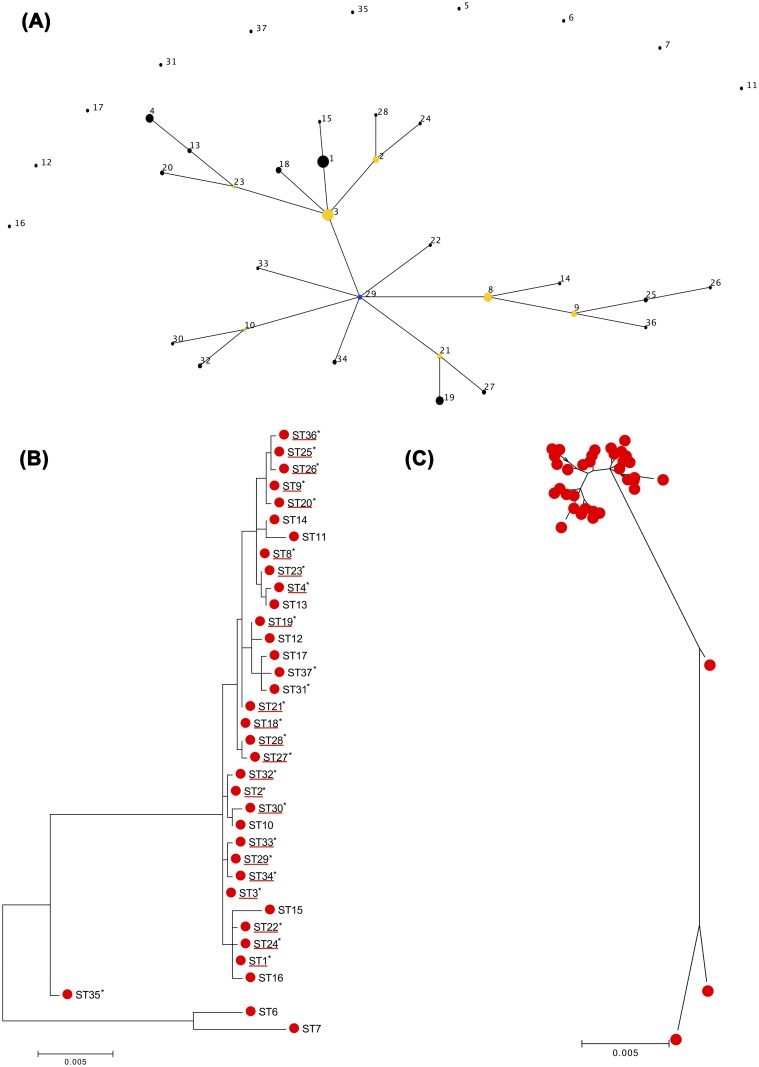
Fig 1. Phylogenetic analysis.
(A) Identification and characterization of a major genetic lineage. Application of eBURST algorithm to MLST data for the collection of 109 S. haemolyticus isolates obtained in this study and that of Cavanagh [11]. The relatedness between STs and clonal complexes was displayed as an eBURST diagram. Each ST is represented by a number and a node, and each line links STs that are single locus variants (SLVs). Bleu node corresponds to the founder (ST29). The size of the node corresponds to the frequency of the isolates. Clusters of linked STs correspond to clonal complexes. (B-C) Phylogenetic trees inferred from the concatenated sequences of the seven MLST loci. Maximum likelihood (ML) Phylogenetic tree was constructed based on concatenated sequences of 7 housekeeping loci for 26 STs obtained in the present study and 17 STs identified in Cavanagh study [11]. The trees were drawn to scale using MEGA 6. The ML analysis identified two groups one containing the great majority of STs that corresponded to CC29 identified by eBURST analysis, and the other containing only four STs. Asterisks indicate the STs identified in this study. STs of CC29 are underlined with red. Each red circle on phylogenetic tree (C) corresponds to an ST [The same ST in ML tree (B)].

