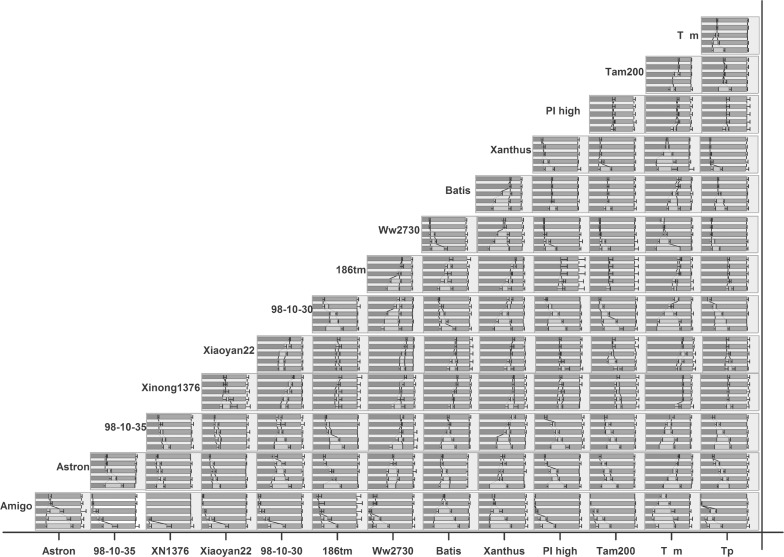
Fig 1. S. avenae alatae selection dynamics between 2 wheat varieties/lines.
This figure includes 91 graphs (14 wheat varieties/lines) representing the random combination of 91 pairs. Each paired combination includes 2 different wheat varieties/lines. Each graph shows how 20 alatae selected between the 2 wheat varieties/lines (for each small graph of the paired combinations, the name of the variety on the left is on the horizontal axis, while the name of the variety on the right is above each graph) at 1 h, 2 h, 4 h, 8 h, and 24h (from the bottom up).

