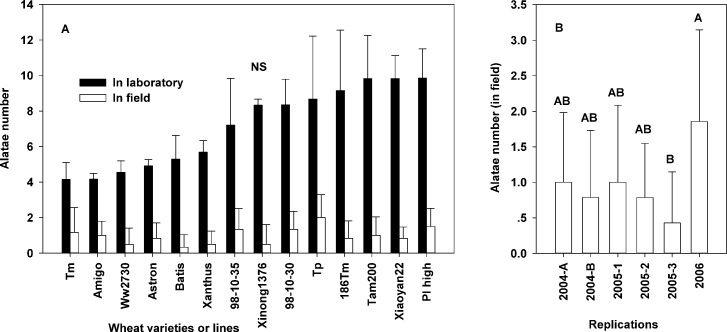
Fig 3. Average number of S. avenae alatae that chose each of the 14 wheat varieties/lines (mean ± SD).
A: The alatae choose among 14 wheat varieties/lines in the laboratory after 24 h (black columns), and in the field during spring (white columns). B: Difference in the number of alatae among 6 fields/sections in 3 years. ‘NS’ above the bar in part A was not significant at p < 0.5. Different capital letters above the bar in part B indicate the significance of differences according to repeats.

